How do elections affect the economy?
Mumbai: The Indian economy typically slows down ahead of Lok Sabha elections even as government intervention turns opportunistic, a
Mint
analysis has found.
A study of key economic variables over the past 30 years shows that
economic activity lost pace significantly every time there was a general
election. Government spending went up in an average election year,
which tended to fuel inflation rather than spur growth, suggesting that
the extra public expenditure ahead of polls was largely wasteful.
The
slowdown in investment and economic activity, however, is more
pronounced this election season because the government failed to take
policy decisions in the past couple of years while battling a raft of
corruption charges.
The consumption of steel, for instance, slowed every time India had an election in the past two decades (see chart 1).
The average growth in steel consumption in an election year is 6.45
percentage points lower compared with a non-election year in this
period.
This
year, the fall has been worsened because of the overall economic
slowdown, with steel consumption falling 5.6% over the year-ago period
in the nine months ended 31 December.
New project additions dry up in an election year (see chart 2).
Investors and businessmen postpone key decisions till a new government
is formed, and wait to gauge what the future policy environment will be
before launching major projects.
At the same time, the pace of industrial credit growth decelerates (see chart 3).
Industrial credit growth slows down as there are fewer industrialists
lining up for bank loans ahead of elections. The average rate of
industrial credit growth in election years was 1.8 percentage points
lower in the past three decades compared with non-election years.
Policy
uncertainty may not be the only reason for the decline in consumption
of raw materials such as steel and cement. Cement consumption declines
ahead of elections as builders divert funds to illicitly fund political
campaigns, research by economist Devesh Kapur and political scientist Milan Vaishnav shows.
Government
spending rises in election years although that affects inflation more
than real economic activity. There’s a clear spike in both total and
revenue spending in election years, or if the elections are held in
April and May, the just-preceding fiscal year (see chart 4).

To be
sure, the fiscal deficit and government spending numbers don’t seem to
follow the pattern in 2013-14. However, this year the government’s hands
were tied by threats of a downgrade by rating agencies.
In
many cases, government intervention in an election year is designed to
cater to special interest groups rather than to provide a boost to the
overall economy. “We find that politicians manipulate fiscal policies
before elections to provide targeted favours to specific interest
groups, possibly in exchange for campaign support,” said a 2002 World
Bank study by Stuti Khemani.
The
amount of farm loans given by state-owned banks was 5-10 percentage
points higher in election years than in years following an election, a
2007 research paper by Harvard University economist Shawn Cole found.
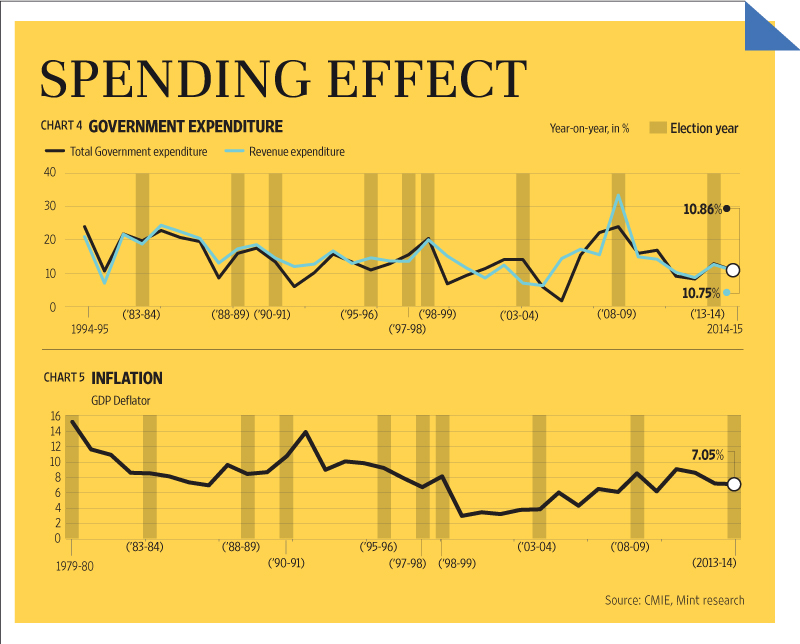
Given
that government spending is usually opportunistic ahead of elections,
the spike in spending fails to lift the economy and instead stokes the
fires of inflation.
Inflation measured by the gross domestic product deflator spikes up around national elections (see chart 5). The average inflation during election years is 8.56% since 1980, compared with 7.55% for non-election years.LOVE KUMAR GUPTA
PGDM 2ND SEM
No comments:
Post a Comment